As a baby developer, my first encounters with pry were nothing short of terrifying. But that fear soon turned to love, and an obsession with understanding and exploring the extensive functionalities of this incredibly powerful tool.
This post explores only a few of the lesser-known tools pry provides, with an eye towards Ruby learners at the beginning of their journey. However, it does presume previous experience using pry breakpoints (binding.pry). If you haven’t used it before, you may want to start with the resources at the bottom.
However, pry isn’t just for debugging - you can drop into pry from your terminal at any time simply by typing ‘pry’, and from there you are ready to begin experimenting! You can do anything you can do in irb in pry (only pry is better).
PRY-DOC
One of my personal favorite features of pry is actually a plugin called pry-doc. To install this, simply enter the following into terminal:
gem install pry-doc
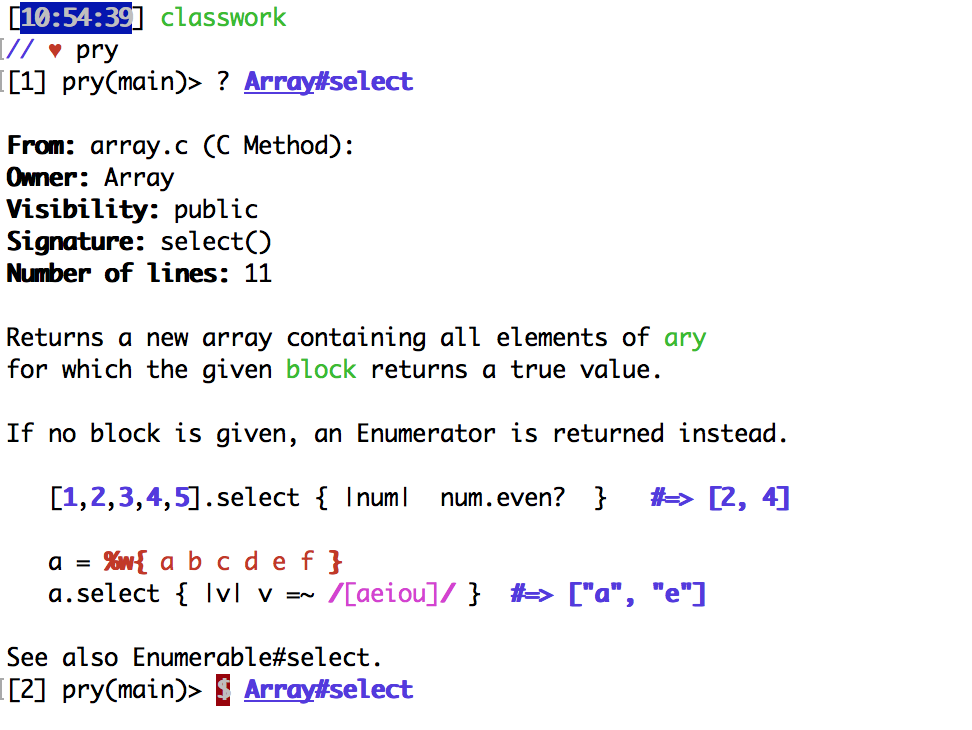
What does this do? Oh you know… Just gives you access to the entire Ruby documentation straight from your terminal!!! I’ve found this incredibly helpful when I can’t remember exactly how a method operates, or need a few quick examples of it in action. Here is a generic example of how to search the documentation:
? Class/Module#method
? is an alias of show-doc And here it is in action:
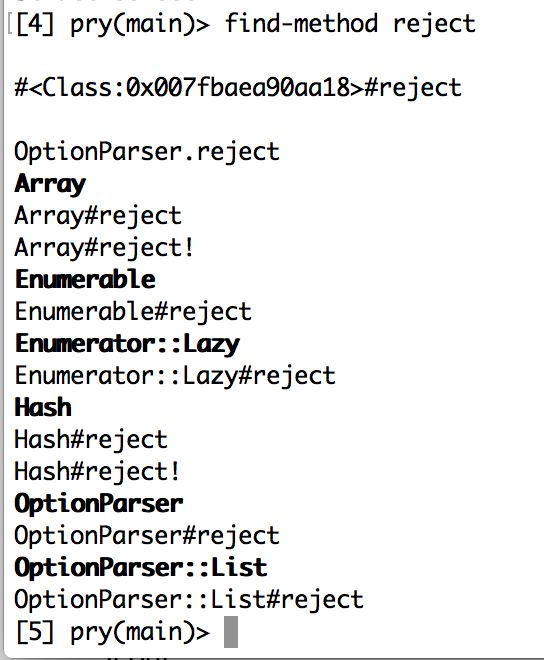
But wait! Maybe you need to know more about the reject method, but can’t remember what class(es) it belongs to. How will you be able to search the documentation? Never fear, pry can help you with that too! Simply type find-method reject (or whatever method you want to find) and pry will pull up a list of classes and modules that can implement the method for you. Searching this way also does not have to be exact, so that our search for reject returns both reject and reject! Check it out:
find-method will ALSO search methods that you have written if you are in a session initiated through a breakpoint.
You can also pull up examples of the source code for any method using show-source Class#method (aliased as $). However, for a baby developer such as myself, this has not proved particularly for Ruby methods as I can’t understand anything written in C, and honestly at this point I just need to know how a thing works.
Flatiron-specific note on using pry-doc: For some reason, pry-doc does NOT play well with learn. If you drop into pry from a directory containing a lab, or your binding.pry was in a lab, you will NOT be able to access the pry-doc. I’m honestly at a loss as to why this happens.
BUT WAIT… WHAT ABOUT METHODS I WROTE?
Glad you asked… because pry can tell you about those too!!!
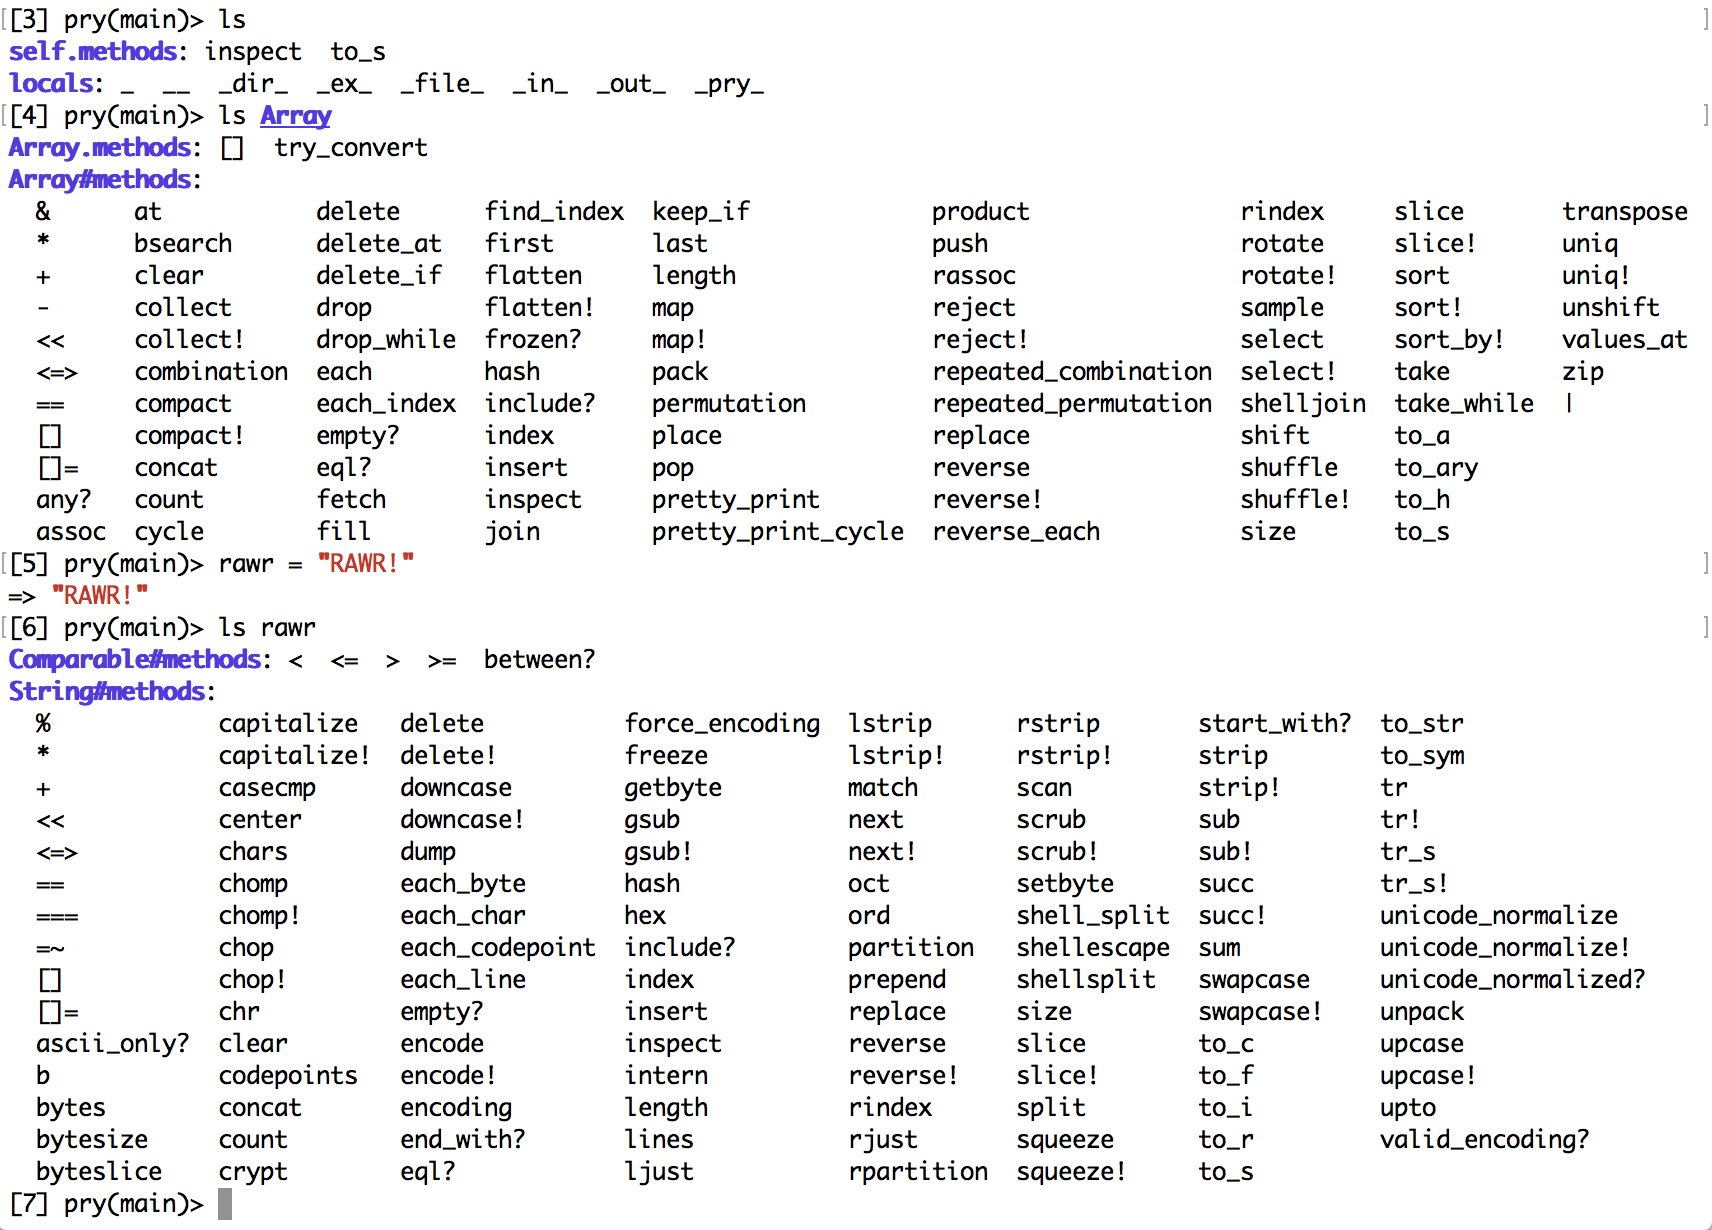
It’s a basic functionality of pry that using the command ls will allow you to see the methods that can be called on a given object. Below are three examples of how this can be implemented:
ls will default to the methods belonging to self (whatever self is at the time)
ls Class/Module will show all methods available to that class and instances of the class
ls variable will show all methods available to that particular object
This seems like it would be pretty helpful in and of itself. BUT! Let’s check out what happens when we call in on classes and instances that we’ve written, rather than those that come with Ruby.
So we’re inside our binding.pry, bopping around and trying to remember what methods a given instance has access to. Let’s see what happens when we call ls on our class Artist, as well as an instance of that class called artist:
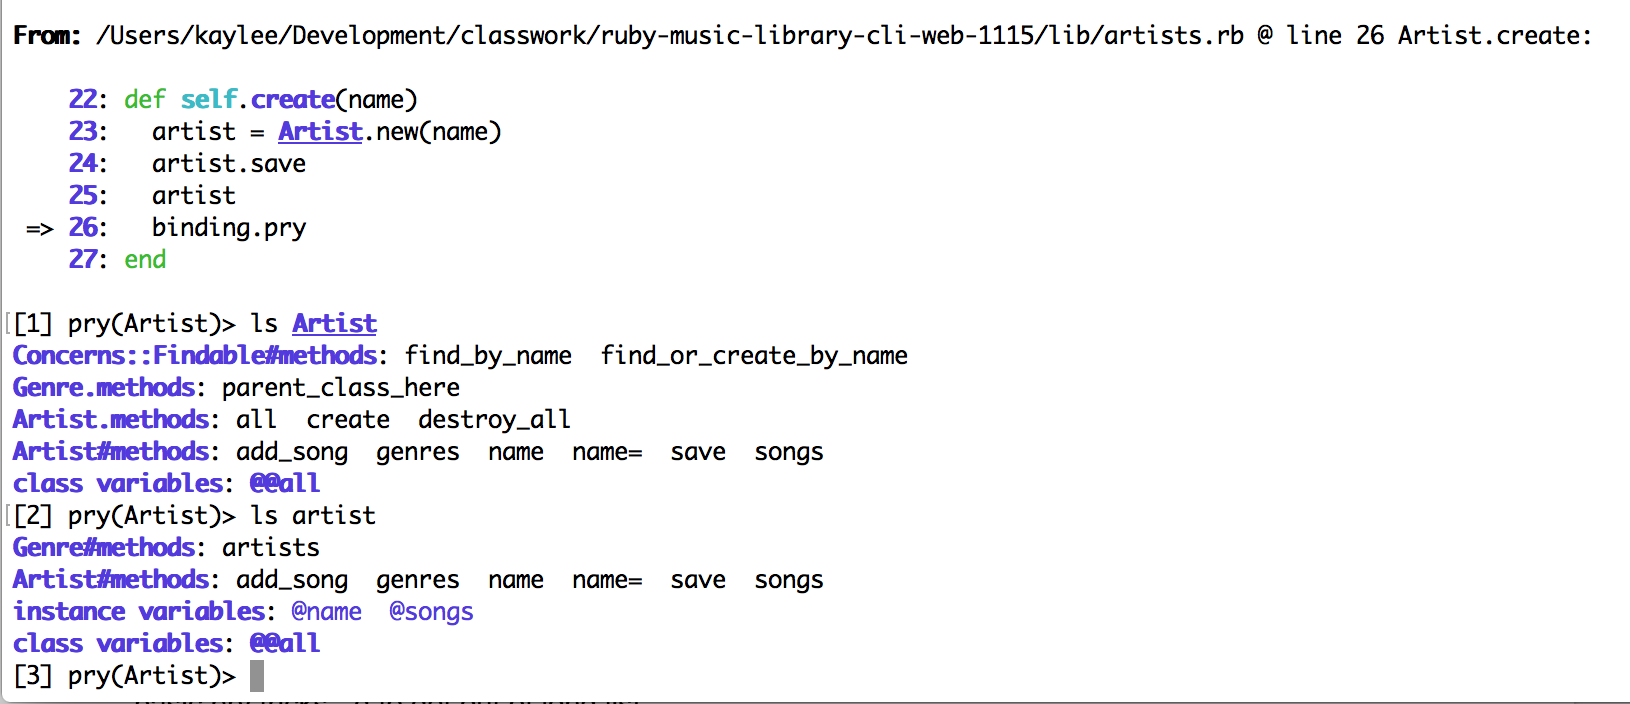
Woah! That’s all the methods we wrote. And not only that, but they’re separated out based on inheritance. We can see that under the list for our Artist class, we first get the methods extended from the module Concerns::Findable, then the class methods from the parent class Genre, then the class methods from Artist itself, then the instance methods available to instance of the Artist class, and finally a list of class variables.
In the list for instance artist, we see first the instance methods from the parent class, then the instance methods from Artist, and finally both the instance and class variables. Note that though both the Genre and Artist classes contain #name methods, only the one contained in the Artist class is listed, as it is the one that our artist instance would use based on the rules of inheritance.
You may have noticed that we only see public methods in this list. If you’d like to see private methods as well, you can add a -p flag: ls artist -p, and it will give a list with private methods highlighted. There are many other options as well; calling ls -h provides a full list.

But wait, there’s more!. This app is pretty small, and the methods are pretty simple. But what if I’m debugging a much larger app, one with many more methods and more complex inheritance relationships. What if during the debugging process I can’t figure out why a particular method isn’t behaving as expected? Wouldn’t it be nice if I could see the source code for that method?
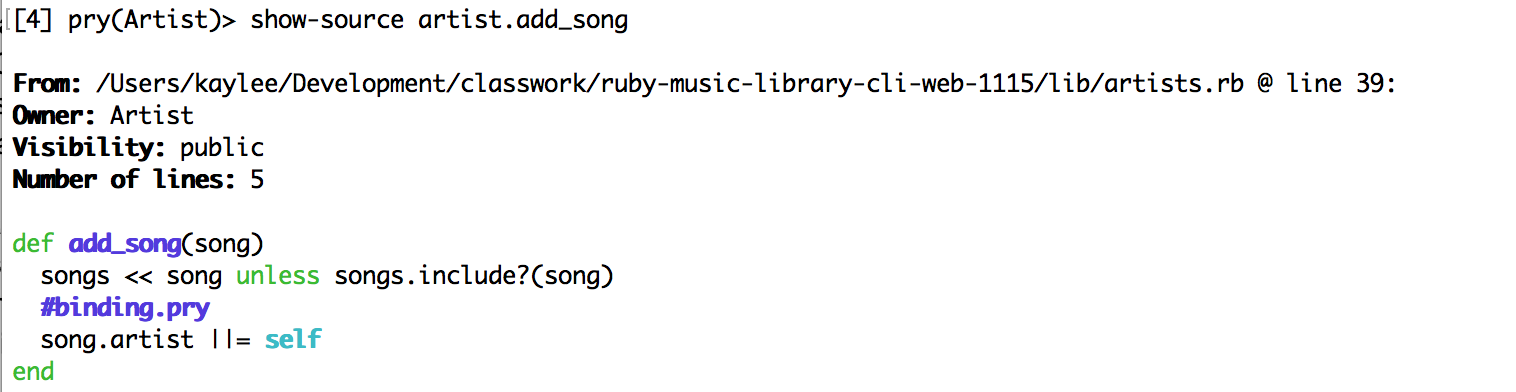
By entering show-source Class/instance.method, pry pulls up the source of that method. It gives us the file and line location of the code, the owner (class or module) of the method, and then shows us the code itself so we can understand exactly how it’s operating.
Note that this show-source syntax is slightly different than the one utilized in the pry-doc calls - you put Class.method as opposed to Class#method.
MOVING IN AND OUT OF OBJECTS
Pry includes a ‘cd’ command that works almost identically to what we’re used to in terminal, except that it allows us to move in and out of objects. Once you ‘cd’ into an object, that object becomes self until you ‘cd’ again, allowing you to directly call commands like ‘ls’ or any methods available to that object. Let’s take a look:
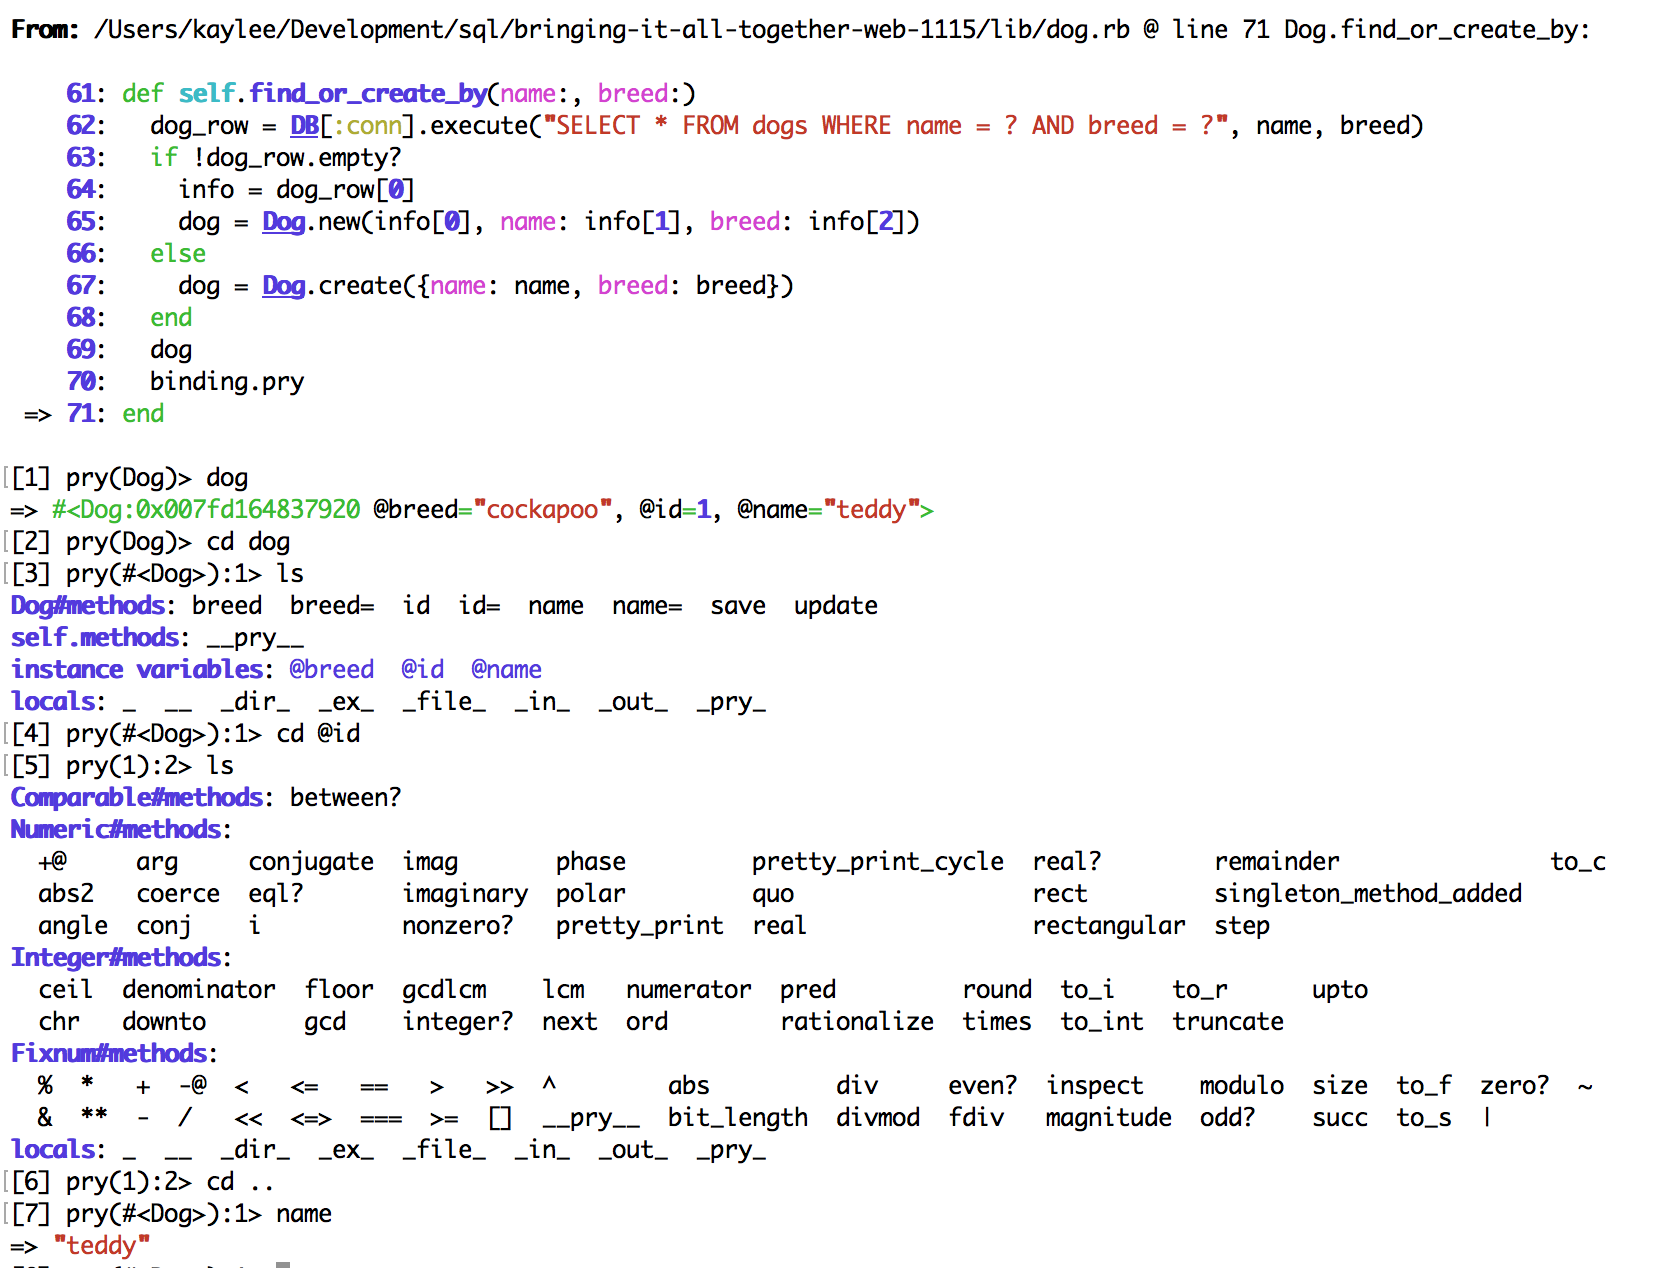
Here we can see that we cd directly into an an instance of the dog class, and that from there ls gives us a list of variable and methods for that object as it is not self. Pry then allows us to cd directly into the instance variable @id, and we can receive a list of methods available for it. Just as in terminal, using cd .. will move us back up a single level, and we can now call the name method directly on our instance of the Dog class.
Pry also helps you keep track of where you are and how many levels you have moved in the cursor the far left where it says: pry(location):level>
QUICK TIPS
- Accessing the terminal: Do you need to quickly do something in the terminal but don’t want to exit your pry session? Append a period to any command and it will get passed to the shell:
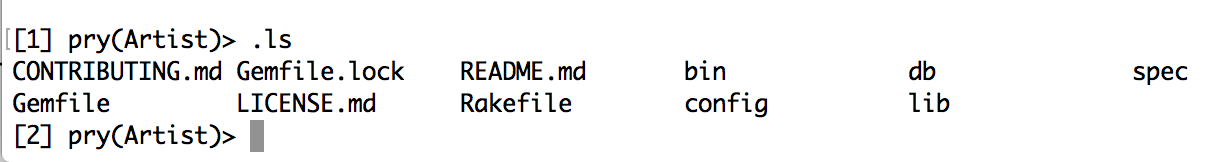
The list given is for the current directory, not for an item in the code we are prying into.
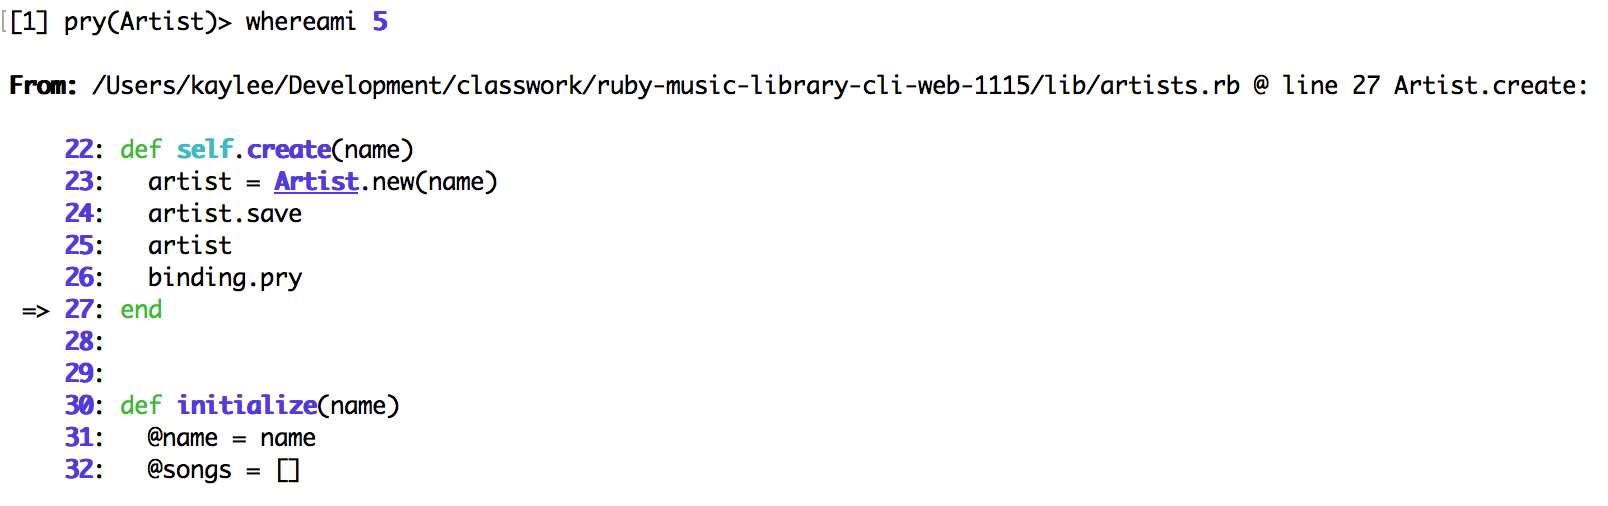
- Have you been prying for too long and lost yourself?
whereamiwill remind you where in the code you currently are. This is automatically executed when you open pry, butwhereamifollows any line plays you may have made, and also takes an optional parameter of the number of lines to show before or after your location, as well as reminding you where in your file this code originates from.
- Use prybaby to automatically comment out all of the pry breakpoints in the directory you are working in. Simply run
gem install prybabyto get started. Once it’s installed, runprybabyin terminal to comment out your breakpoints. Useprybaby -uto uncomment all the breakpoints, andprybaby -rto delete them. (Beware though - it deletes the entire line containing thebinding.pry.) Thanks Sophie for this recommendation!